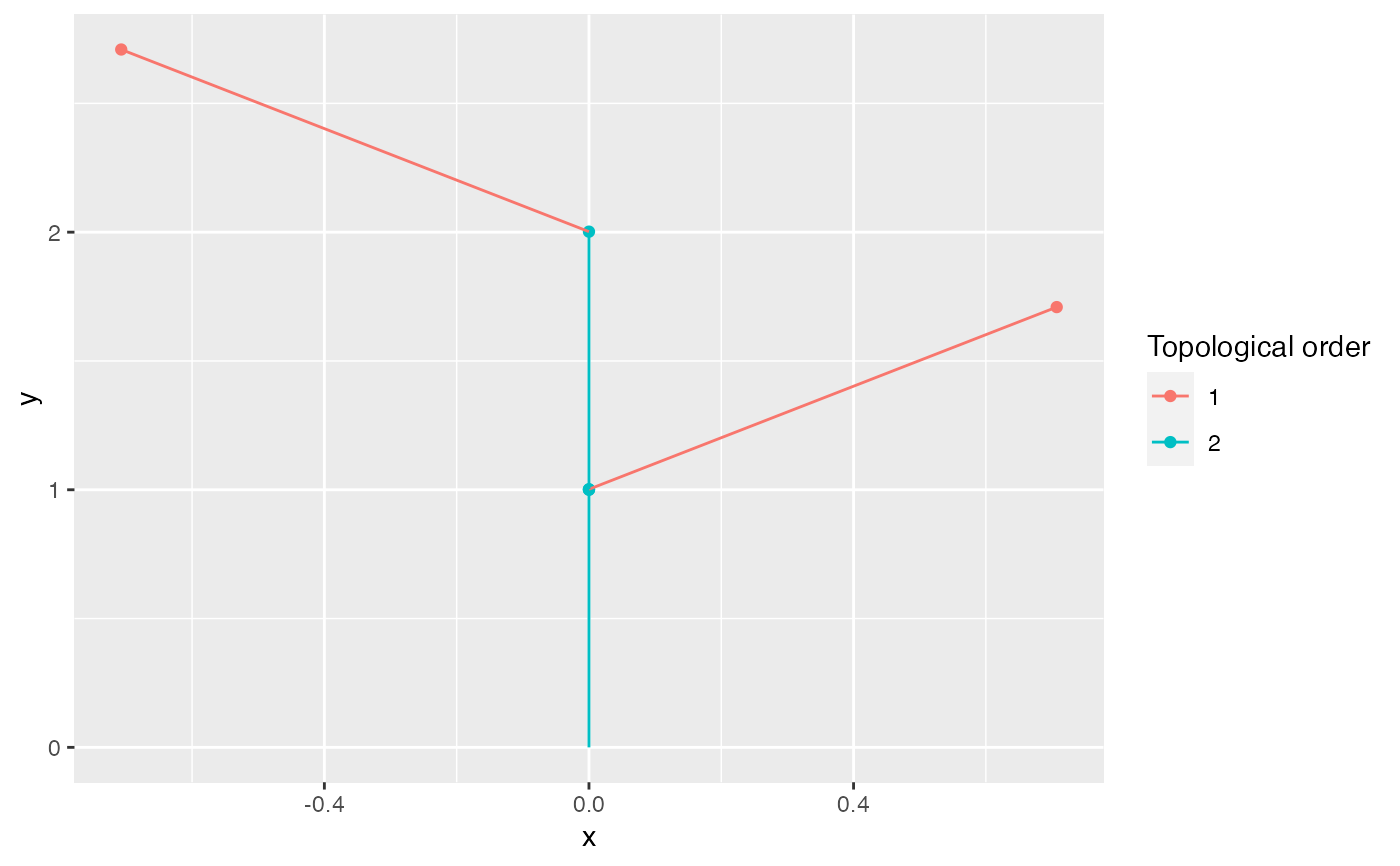
Plot an MTG
# S3 method for mtg
autoplot(mtg, scale = NULL, angle = 45, phylotaxy = TRUE, ...)

# S3 method for Node
autoplot(mtg, scale = NULL, angle = 45, phylotaxy = TRUE, ...)
Arguments
| mtg | An MTG, as from |
|---|---|
| scale | The scale required for plotting |
| angle | Insertion angle when branching |
| phylotaxy | Is phylotaxy required ? Uses 180 degrees if |
| ... | Further arguments. |
Value
A ggplot of the MTG
Details
The function needs the topological orders as attributes in the MTG. If they
are not present, it uses topological_order() to compute it with descending order.
If you need ascending order, please use topological_order(MTG, ascend = TRUE) before
plotting.
Examples
library(ggplot2) filepath= system.file("extdata", "simple_plant.mtg", package = "XploRer") MTG= read_mtg(filepath)#> Warning: the condition has length > 1 and only the first element will be used#> Warning: the condition has length > 1 and only the first element will be used#> Warning: the condition has length > 1 and only the first element will be used#> Warning: the condition has length > 1 and only the first element will be used