Makie.jl recipes
Page Info
Audience: Beginner to Intermediate
Prerequisites: MTG loaded in memory
Time: 8 minutes
Output: 2D/3D topology diagrams with Makie
Diagram
We can make a diagram of the MTG graph using the diagram function:
julia
using PlantGeom, CairoMakie
opf = read_opf(joinpath(dirname(dirname(pathof(PlantGeom))),"test","files","simple_plant.opf"))
diagram(opf)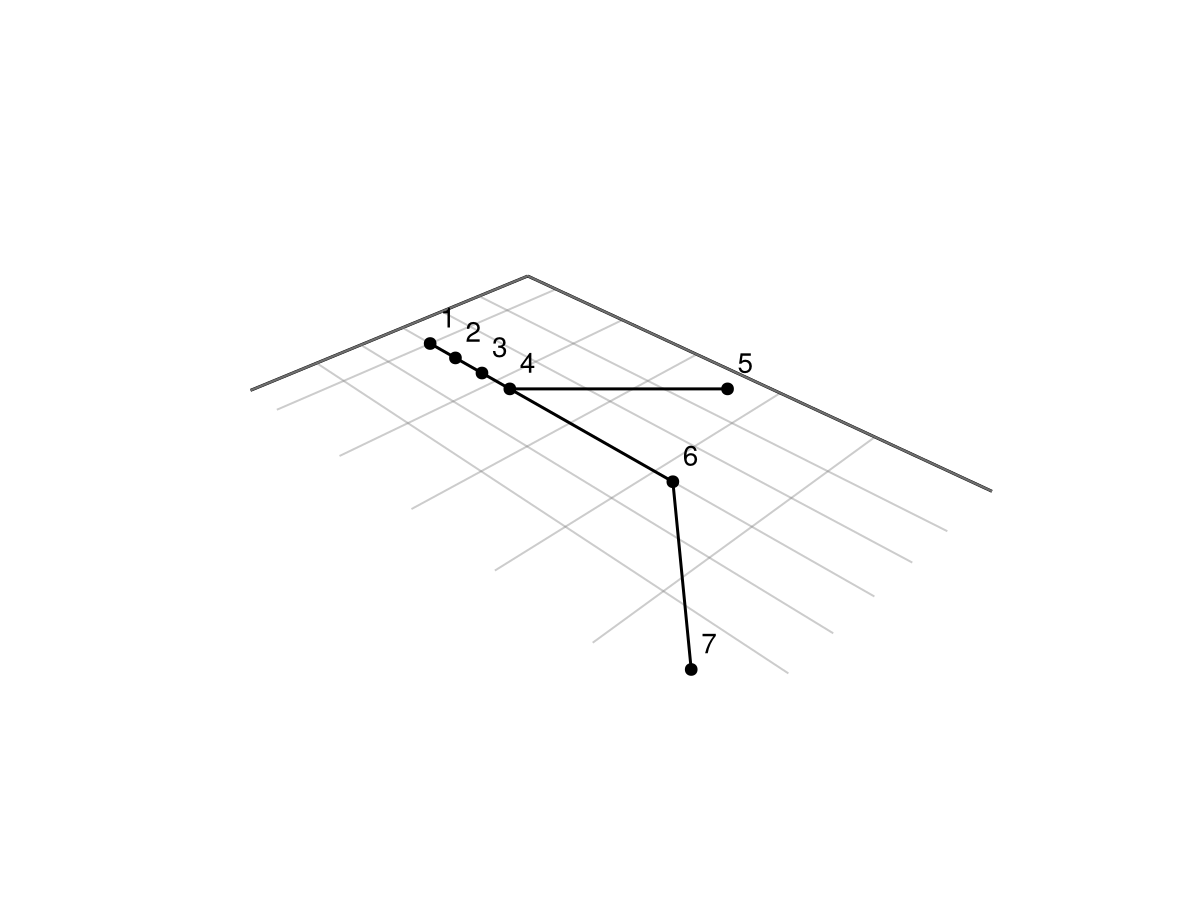
We can change the color of the nodes:
julia
diagram(opf, color = :palegreen1)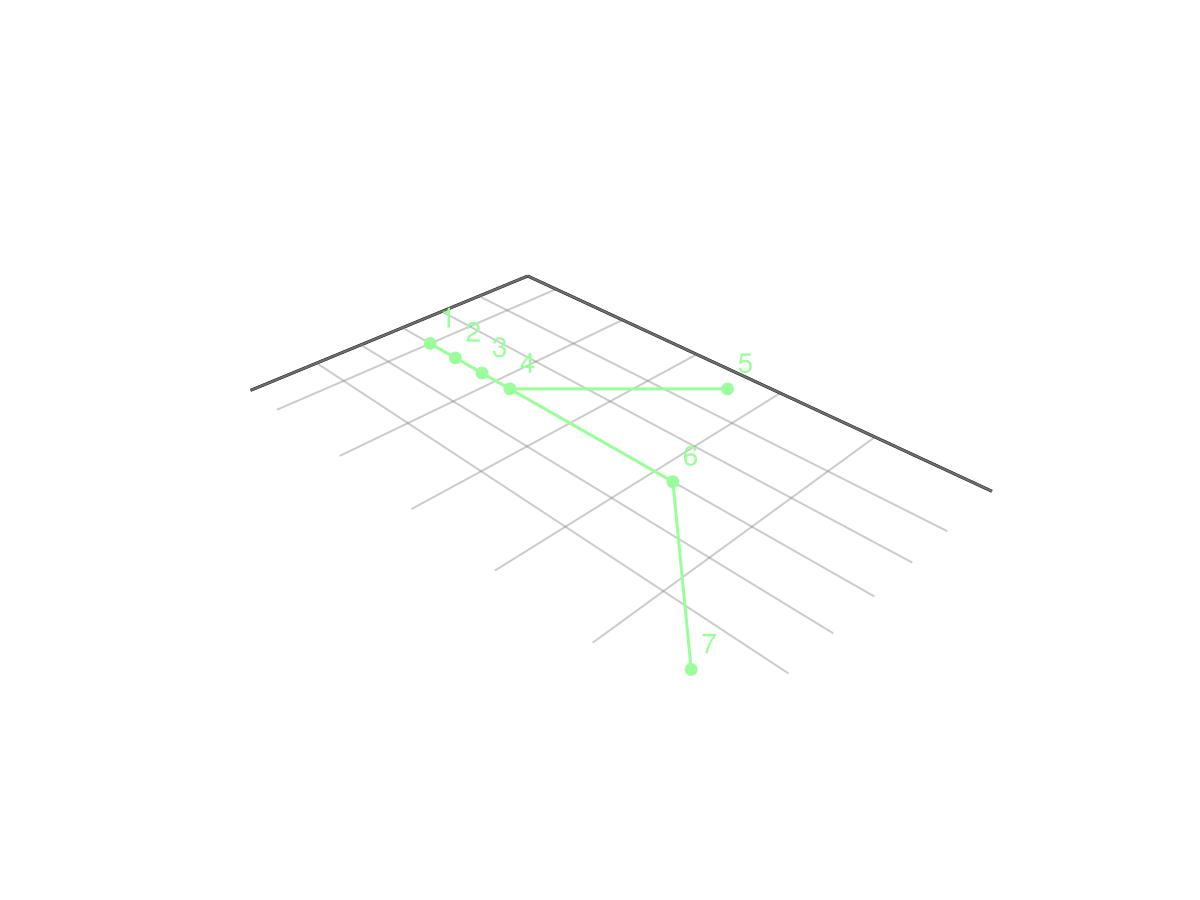
The color argument is for the node color. The edges are colored with the same color than the nodes by default, but you can also use a different color if you want using edge_color:
julia
diagram(opf, color = :palegreen1, edge_color = :sienna)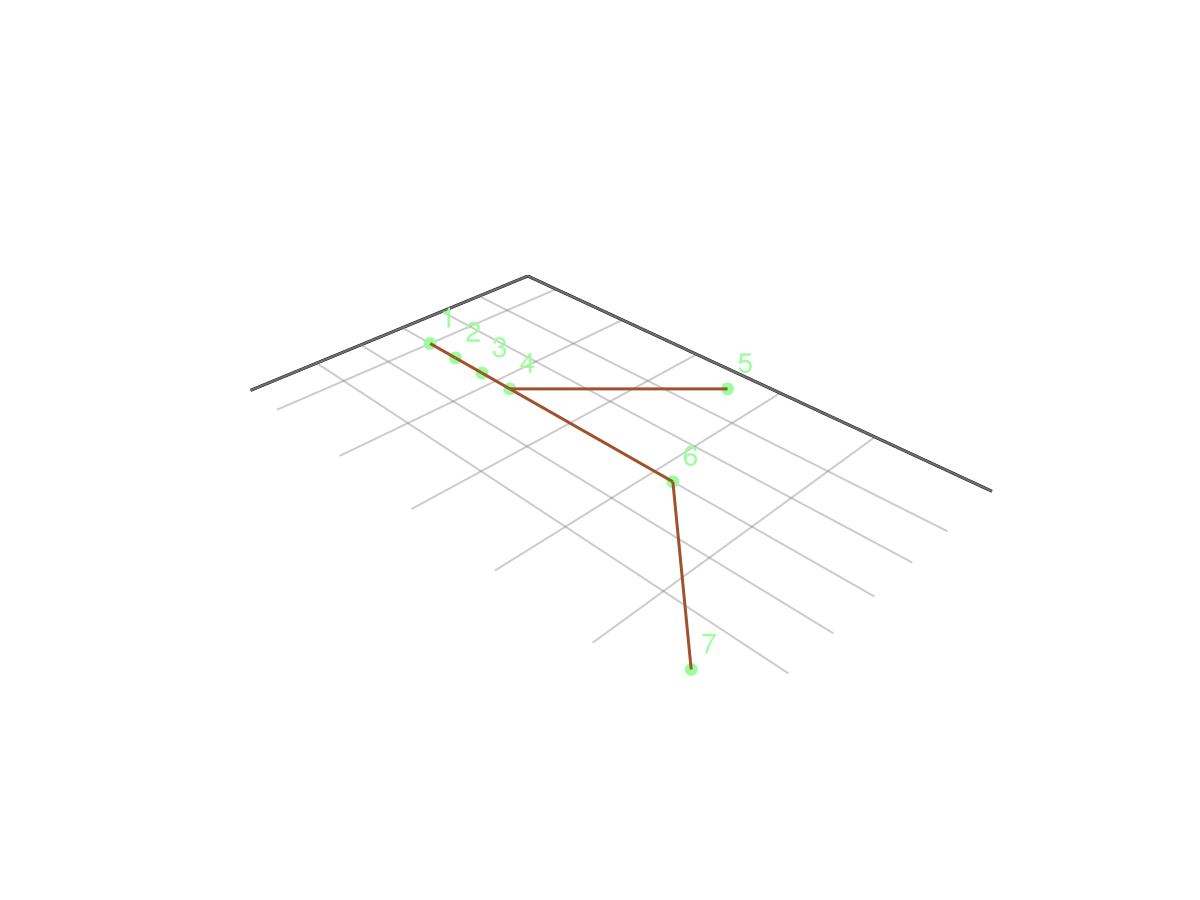
You can also color your nodes based on an attribute from the MTG, e.g. using the nodes Z coordinates:
julia
# First, we compute "fake" coordinates for each node in the MTG (just for ploting):
PlantGeom.coordinates!(opf, force = true)
# Then we plot the MTG using the newly created ZZ attribute:
diagram(opf, color = :YY)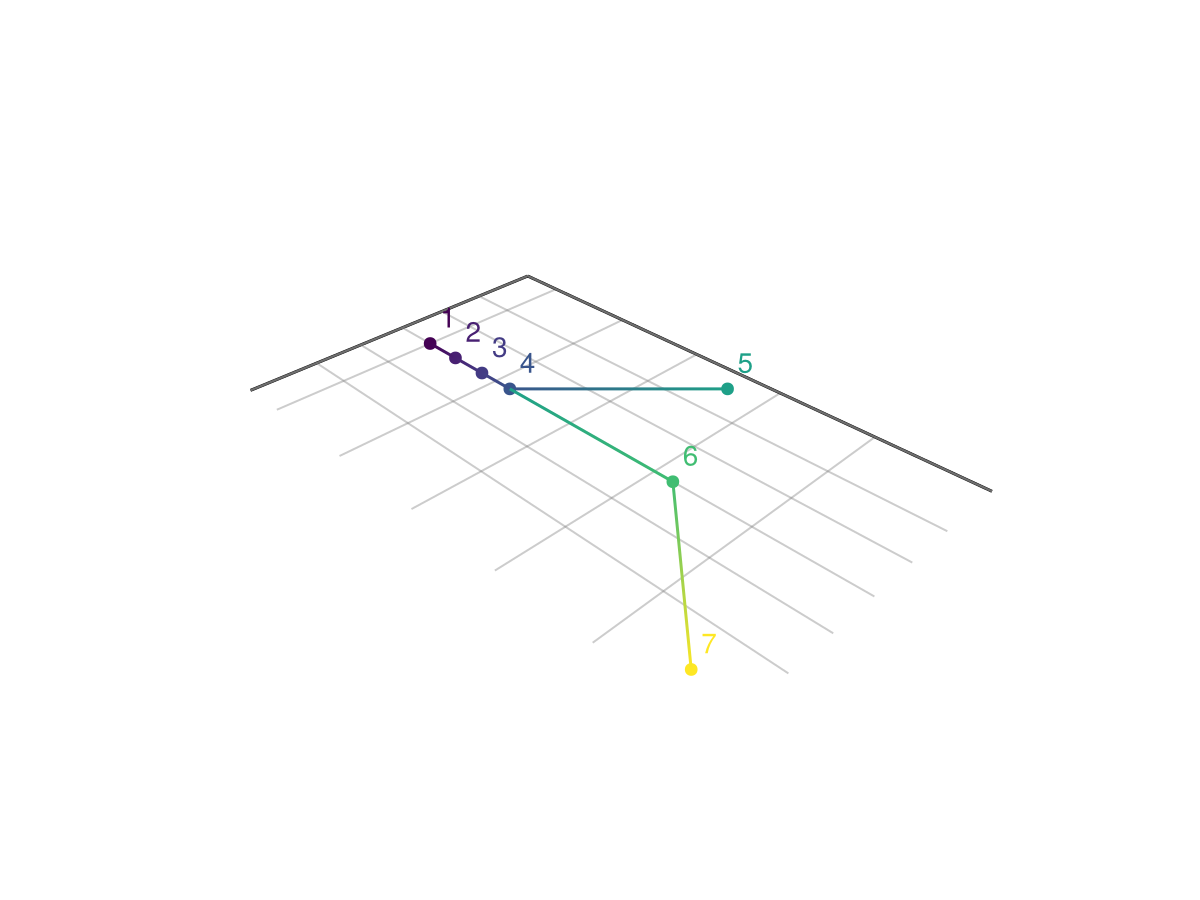
We can also color the edges differently, e.g. using the XX attribute computed using coordinates!:
julia
PlantGeom.coordinates!(opf, force = true)
diagram(opf, color = :YY, edge_color = :XX)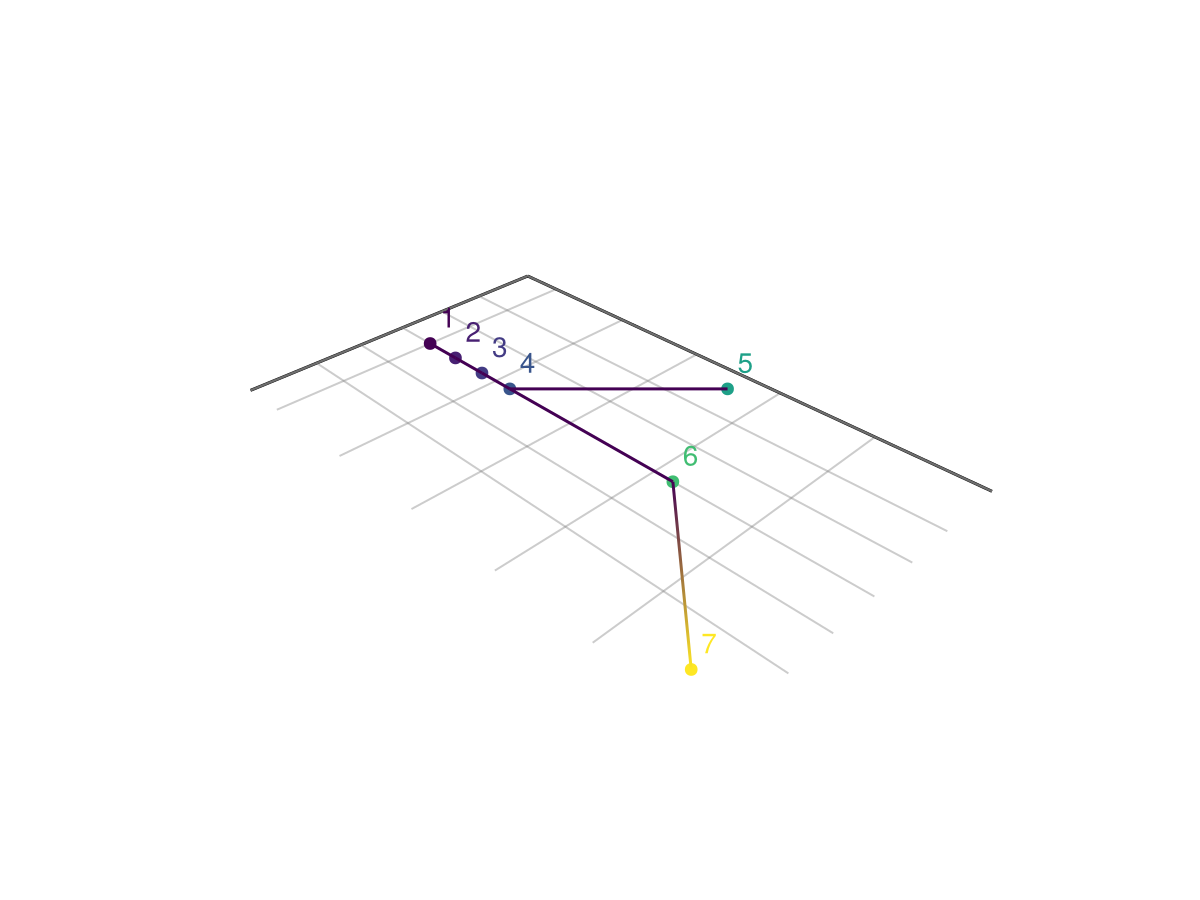
Attributes used for coloring may have missing values. In this case you can choose their color using color_missing, e.g.:
julia
diagram(opf, color = :Length, edge_color = :Width, color_missing = :red)